What Peptide Purity Really Means (and How It's Measured)
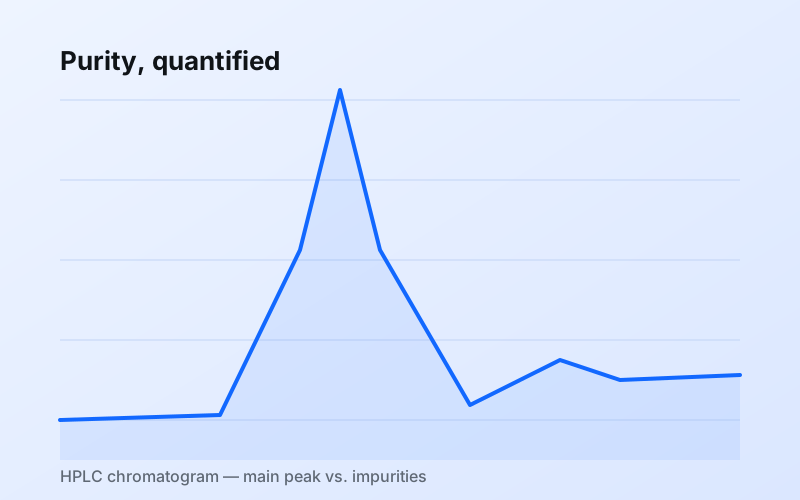
Every certificate of analysis leads with a purity figure — 98%, 99%, sometimes higher. It is the single most cited spec in peptide research procurement, and also the most misread. Purity is not an intrinsic property of a vial; it is the output of a specific analytical method run under specific conditions. Understanding that method is what lets you compare two documents honestly.[1]
How the number is calculated
The purity value on most peptide COAs comes from reversed-phase high-performance liquid chromatography (RP-HPLC). A sample is pushed through a column that separates molecules by hydrophobicity; a UV detector records absorbance as each component elutes. The result is a chromatogram — a trace of signal over time, where each peak is a distinct species.
Purity is reported as the area percentage of the main peak relative to the total integrated peak area:
Purity (%) = (Area of main peak ÷ Total area of all peaks) × 100
Two consequences follow immediately. First, purity is relative — it describes the sample's composition as the detector sees it, not an absolute count of molecules. Second, anything the detector cannot see does not count against the number. A UV detector set to 214 nm responds to peptide bonds, but residual salts, water, and counter-ions are largely invisible to it.[2]
Purity is not the same as content
This is the distinction that trips people up. Chromatographic purity tells you what fraction of the peptide-related material is your target sequence. Net peptide content tells you how much actual peptide is in the vial, with the rest being water, acetate or trifluoroacetate counter-ions, and residual reagents. A vial can be 99% pure and still be only ~80% peptide by mass.
When a figure is dropped in as a static image rather than a live chart, it gets the same treatment — reserved dimensions, descriptive alt text, a caption, and a source line:
What to check before trusting a purity figure
Because purity depends on method, a defensible COA states the method alongside the number: the column chemistry, gradient, detection wavelength, and the retention time of the main peak. Two labs reporting "99%" on different gradients are not necessarily reporting the same thing.[3] Identity should be confirmed orthogonally — typically by mass spectrometry — so you know the main peak is actually the intended sequence and not a co-eluting impurity.
In short: read purity as "area percent by this HPLC method," pair it with net peptide content and a mass-spec identity confirmation, and you have a number you can actually compare across suppliers. For a section-by-section walkthrough of the rest of the document, see our guide on how to read a certificate of analysis.
For research use only. Not for human or veterinary use. This article is educational and does not constitute analytical, medical, or regulatory advice.
References
- International Council for Harmonisation. "Q6A: Specifications — Test Procedures and Acceptance Criteria for New Drug Substances and New Drug Products." ich.org.
- United States Pharmacopeia. "<621> Chromatography." usp.org.
- Snyder, L. R., Kirkland, J. J., Dolan, J. W. "Introduction to Modern Liquid Chromatography," 3rd ed., Wiley.